|
Elastic Stack 5 : Install Heartbeat
2017/05/11 |
|
Install Heartbeat that can monitor services for their availability with active probing.
|
|
| [1] | Install Heartbeat. Configure Elasticsearch repository before it. |
|
[root@dlp ~]# yum -y install heartbeat
|
| [2] | Configure basic settings and start Heartbeat. |
|
[root@dlp ~]#
vi /etc/heartbeat/heartbeat.yml # line 13: set items # by default, monitored the URL http://localhost:9200 like follows heartbeat.monitors: - type: http # List or urls to query urls: ["http://localhost:9200"] # Configure task schedule schedule: '@every 10s' # Total test connection and data exchange timeout #timeout: 16s # for example, add the setting that monitors another host with ICMP per 5 minutes - type: icmp schedule: '*/5 * * * * * *' hosts: ["10.0.0.18"] # for example, add the setting that monitors 22/TCP on another host per 5 minutes - type: tcp schedule: '@every 10s' hosts: ["10.0.0.18:22"] ..... ..... # line 54: specify output destination # by default, it set to Elasticsearch on localhost # if output to Logstash, comment out there lines and uncomment the line 64,66 output.elasticsearch: # Array of hosts to connect to.l hosts: ["localhost:9200"] ..... ..... #output.logstash: # The Logstash hosts #hosts: ["localhost:5044"][root@dlp ~]# systemctl start heartbeat [root@dlp ~]# systemctl enable heartbeat
|
| [3] | Make sure the data has been collected normally. |
|
# index list [root@dlp ~]# curl localhost:9200/_cat/indices?v health status index uuid pri rep docs.count docs.deleted store.size pri.store.size yellow open metricbeat-2017.05.12 YvHWPjbgS12e_oU5Ddi3rA 5 1 314824 0 80.8mb 80.8mb yellow open packetbeat-2017.05.12 ZzVaYEjYSNyRGMIHNEaVnw 5 1 5887 0 2mb 2mb yellow open filebeat-2017.05.12 P6KJJIBDTcK4m4OzYT1lbA 5 1 426 0 173.9kb 173.9kb yellow open sshd_fail-2017.05 owhoRGiwTWGdZaqKAMw66g 5 1 91 0 304.8kb 304.8kb yellow open .kibana FGjE6bGUTlioELtM_QynMQ 1 1 214 19 322.8kb 322.8kb yellow open heartbeat-2017.05.12 ZeLIO35uSuqQPk-2jA-ZNA 5 1 10 0 64.2kb 64.2kb # document list on the index [root@dlp ~]# curl localhost:9200/heartbeat-2017.05.12/_search?pretty
{
  "took" : 2,
  "timed_out" : false,
  "_shards" : {
    "total" : 5,
    "successful" : 5,
    "failed" : 0
  },
  "hits" : {
    "total" : 21,
    "max_score" : 1.0,
    "hits" : [
      {
        "_index" : "heartbeat-2017.05.12",
        "_type" : "icmp",
.....
.....
|
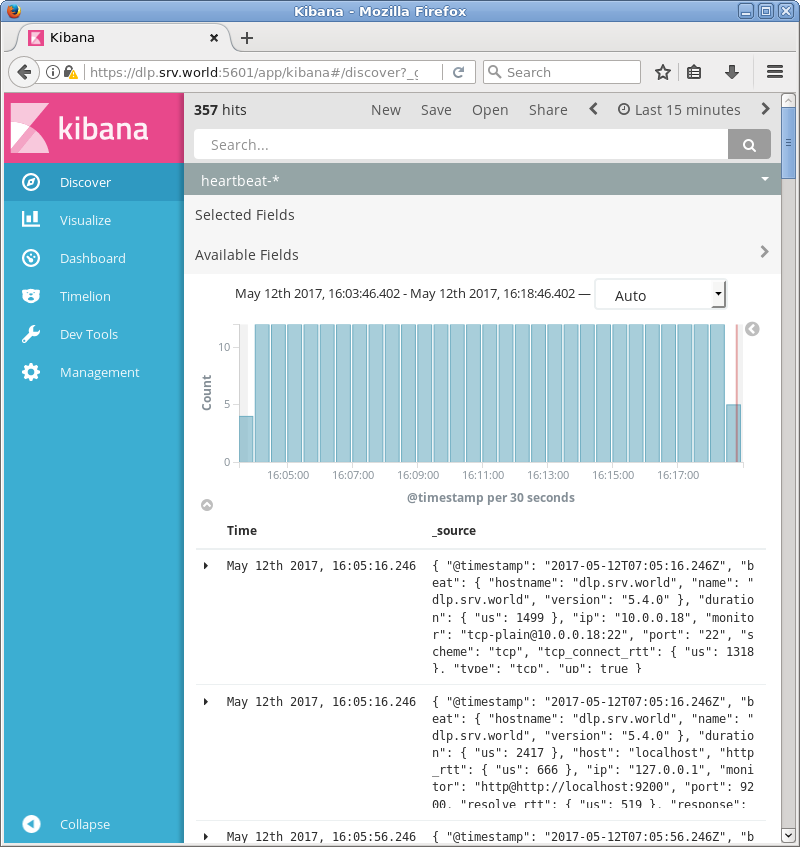
| [4] | If Kibana is running, it's possible to use import script to Dashboard. |
|
[root@dlp ~]# /usr/share/heartbeat/scripts/import_dashboards Create temporary directory /tmp/tmp982444776 Downloading https://artifacts.elastic.co/downloads/beats/beats-dashboards/beats-dashboards-5.4.0.zip Unzip archive /tmp/tmp982444776 Importing Kibana from /tmp/tmp982444776/beats-dashboards-5.4.0/filebeat Importing Kibana from /tmp/tmp982444776/beats-dashboards-5.4.0/heartbeat ..... ..... |
|